

Reg Stats
The charts on this page have been featured in a number of publications. Please contact us if you would like to use these files in your publication or presentation.
The effects of regulation—both benefits and costs—are difficult to measure, particularly when considered in the aggregate. As a result, analysts often turn to indirect proxies to understand the reach and impact of regulations over time.
The information here provides accessible charts and supporting data to better understand disparities and similarities across presidential administrations, and their cumulative approaches to implementing regulatory policy. Our team of policy analysts update these charts on a regular basis as new data are available.
If you would like to see us include other data points, or have questions about the information presented here, please email [email protected].
Recent Highlights

"The United States Congress"
Professors E. Scott Adler (U. of Colorado-Boulder) Jeffery A Jenkins (U. of Southern California), and Charles R. Shipan's (U. of Michigan) 2021 textbook features our "Total Pages in the Federal Register" chart.

The Wall Street Journal
Jacob M. Schlesinger, WSJ Senior Washington Correspondent, features our "Economically Significant Final Rules Published by Presidential Year" chart in a March 2021 article, "Biden’s Hurdle: Courts Dubious of Rule by Regulation."

"Capitalism in America"
Former chairman of the Federal Reserve Board Alan Greenspan and the Economist's political editor Adrian Wooldridge's 2018 book features our "Pages in the Code of Federal Regulations" chart.
Economically Significant Final Rules Published by Presidential Year

This graph presents the number of economically or section 3(f)(1) significant final rules published each presidential year (February 1 – January 31). Economically significant rules are regulations issued by executive branch agencies that meet the original definition in section 3(f)(1) of Executive Order 12866: “have an annual effect on the economy of $100 million or more or adversely affect in a material way the economy, a sector of the economy, productivity, competition, jobs, the environment, public health or safety, or State, local, or tribal governments or communities.” Executive Order 14094 of April 6, 2023 amended this definition by increasing the threshold to $200 million, and rules meeting the new definition are commonly referred to as section 3(f)(1) significant rules. Starting April 6, 2023, this graph tracks the number of section 3(f)(1) significant rules based on the new definition in Executive Order 14094.
See the breakdown of economically or section 3(f)(1) significant final rules published by presidential year for specific agencies on this page.
Cumulative Economically Significant Final Rules by Administration


Rules Published in the Federal Register by Presidential Year

Published by the Office of the Federal Register, National Archives and Records Administration, the Federal Register is the official daily publication for rules, proposed rules, and notices of Federal agencies and organizations, as well as executive orders and other presidential documents. This chart shows the number of final rules and proposed rules published in the Federal Register by presidential year, beginning in 1995.
Major Final Rules Published by Presidential Year

The Government Accountability Office reports on “major” rules published. The Congressional Review Act, passed in 1996, defines a major rule as “one that has resulted in or is likely to result in (1) an annual effect on the economy of $100 million or more; (2) a major increase in costs or prices for consumers, individual industries, federal, state, or local government agencies, or geographic regions; or (3) significant adverse effects on competition, employment, investment, productivity, or innovation, or on the ability of the United States-based enterprises to compete with foreign-based enterprises in domestic and export markets.”
Regulators' Budget Report
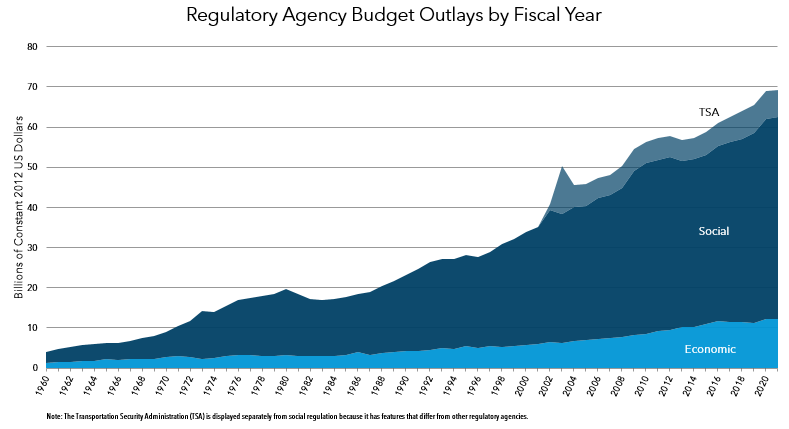
Agency Budget Outlays by Fiscal Year
A chart on regulatory agency budget outlays by fiscal year from our annual Regulators' Budget report, co-published with the Weidenbaum Center at Washington University in St. Louis.
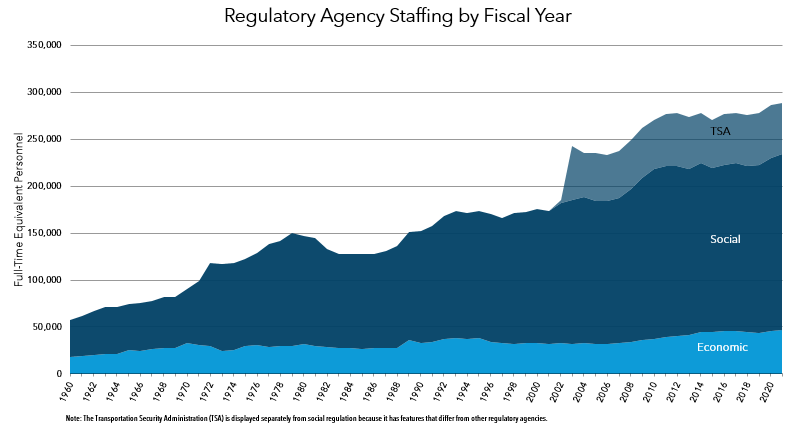
Full-Time Equivalent Personnel by Fiscal Year
A chart on regulatory agency personnel by fiscal year from our annual Regulators' Budget report, co-published with the Weidenbaum Center at Washington University in St. Louis.
Significant Final Rules Published by Presidential Year

This graph presents the number of significant final rules published each presidential year (February 1 – January 31). Significant rules are defined in Section 3(f) of Executive Order 12866 (September 30, 1993), as amended by Executive Order 14094 (April 6, 2023). Significant rules include economically or section 3(f)(1) significant rules.
Total Pages in the Code of Federal Regulations and the Federal Register

Total Pages Published in the Code of Federal Regulations
The Code of Federal Regulations (CFR) is the codification of the general and permanent rules promulgated by the departments and agencies of the federal government. The number of total pages published in the CFR annually provides a sense of the volume of existing regulations with which American businesses, workers, consumers, and other regulated entities must comply.

Total Pages Published in the Federal Register
The number of pages in the Federal Register—the daily journal of the federal government in which all newly proposed rules are published along with final rules, executive orders, and other agency notices—provides a sense of the flow of new or changed regulations issued during a given period. These regulations might increase or decrease regulatory burdens, making this an imperfect—but frequently cited—measure of regulatory burden.
Active Actions Published in the Unified Agenda

This graph tracks active actions published in the semiannual Unified Agenda of Regulatory and Deregulatory Actions beginning with fall 1995. Active actions include pre-rules, proposed rules, and final rules.