
On the Friday before Memorial Day, the Office of Management and Budget (OMB) released its semiannual Unified Agenda listing ongoing and upcoming regulations planned by agencies. As can be seen in the tables below, regulatory actions in the Unified Agenda are split into three primary categories: active, long-term, and completed regulatory actions.
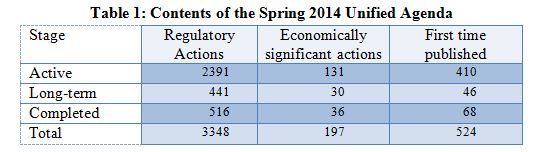
The Spring 2014 Unified Agenda includes 3,348 total regulatory actions, 524 of which are appearing in the Agenda for the first time, and 197 of which are “economically significant.”* The majority (71%) of the regulatory actions in the Spring Agenda are listed as “active,” of which 17% are published for the first time in this Agenda.
How Does the Spring 2014 Agenda Compare?
As can be seen in Table 2 below, the number of total regulatory actions listed in the Spring 2014 Unified Agenda does not differ significantly from the number of total actions listed in the previous Unified Agenda, published in Fall 2013.
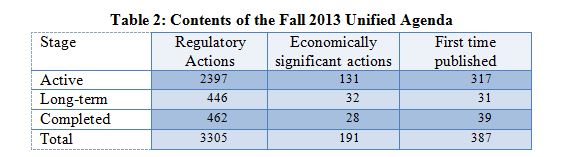
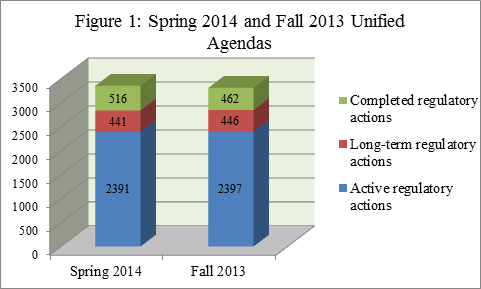
While there was a very slight decrease in active regulatory actions between Fall 2013 and Spring 2014, the count of total regulatory actions (including “long-term” and “completed”) increased from 3,305 to 3,348, and the number of economically significant actions and regulatory actions published for the first time also increased. However, the increase in total regulatory actions listed in the spring Agenda is entirely a result of an increase in the number of “completed” regulatory actions, which does not have any effect on regulations that the public can expect in the coming year. Figure 1 below shows a side-by-side comparison of the contents of the Spring 2014 and Fall 2013 Unified Agendas.
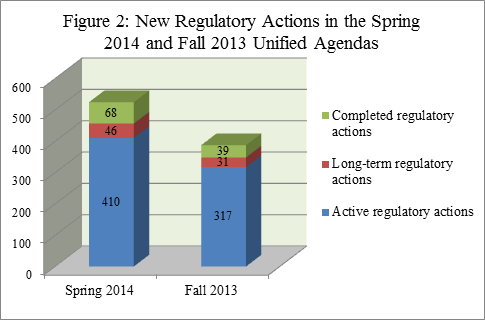
It is also useful to compare the number of new regulatory actions—that is, actions listed for the first time in the Agenda—to identify rates of regulatory growth over time. As can be seen in Figure 2 below, the Spring 2014 Agenda lists 137 more regulatory actions for the first time than the Fall 2013 Agenda, with 524 new regulatory actions appearing in the latest Agenda.
Conclusions
While the number of regulatory actions increased from the Fall 2013 Unified Agenda to the Spring 2014 Agenda, this is a result of an increase in the number of “completed” regulatory actions, which does not have any effect on regulations that the public can expect in the coming year. However, it is worth noting that the number of economically significant actions listed in the Agenda has increased, as well as new regulatory actions appearing for the first time in the Unified Agenda.
* According to Executive Order 12866, an “economically significant” regulatory action is one which has “an annual effect on the economy of $100 million or more or adversely affect in a material way the economy, a sector of the economy, productivity, competition, jobs, the environment, public health or safety, or State, local, or tribal governments or communities.”