
Susan E. Dudley
Melinda Warren
Each year we examine the President’s proposed Budget of the United States to identify the outlays and staffing devoted to developing and enforcing federal regulations. This “regulators’ budget” report covers agencies whose regulations primarily affect private-sector activities, and expressly excludes budget and staffing associated with regulations that govern taxation, entitlement, procurement, subsidy, and credit functions.
Overall, we find that the regulators’ budget continues to grow at a modest pace. The President’s proposed budget for regulatory activities in FY 2015 is $60.9 billion, a real (inflation-adjusted) increase of 3.5 percent above estimated FY 2014 outlays. The FY 2014 regulators’ budget of $57.8 billion is 2.0 percent larger than FY 2013 regulatory agencies’ outlays of $55.9. The Budget also requests increases in federal regulatory agency personnel of 0.8 percent in FY 2015 and 2.0 percent in FY 2014.Our most recent report presents the President’s requested budget outlays in fiscal year (FY) 2015, as well as estimated outlays for FY 2014. It also provides 56 years of data on annual outlays and staffing from fiscal year 1960 to the present. (See figures below.) These data reflect the on-budget costs of regulation, and do not provide information on the social costs or benefits of regulations. Nevertheless, the time-series data presented here offer useful insights into the growth and changing composition of regulation over the last half-century.
One of the most interesting (though not surprising) findings of our analysis is that while tight budgets are constraining regulatory spending at many federal agencies, those that are at least partially funded by fees on the entities they regulate are supporting substantial increases in regulatory outlays and staffing. For example, while the Environmental Protection Agency’s outlays shrank by almost 4 percent in 2014, the Food and Drug Administration’s budget grew by more than 29 percent. The Consumer Financial Protection Bureau’s spending increased 33 percent in 2014 and outlays of both the Patent and Trademark Office and Securities and Exchange Commission grew by more than 10 percent. The growth in spending and staffing at these agencies appears to reflect not only the increased scope of their regulatory activities, but a greater ability to finance these activities from revenue sources that are less affected by Congressional spending limits, such as fees on the entities they regulate.
This year’s analysis also documents some interesting long-term shifts in regulatory spending patterns, including a trend in which overall outlays devoted to economic regulatory activities, including price, quality, and entry regulation, are increasing at a faster rate than those aimed at social regulatory activities, such as environmental, safety and health issues. This reverses a trend that began in the 1970s away from economic regulation of private-sector activities, and would likely be more dramatic if our data included agencies of the Department of Health and Human Services that pursue economic regulation of health insurance markets pursuant to the Affordable Care Act. While the staffing and outlays devoted to these regulations do fit the criteria for inclusion in this report, the 2015 Budget did not allow us to distinguish between resources devoted to regulations that affect private-sector behavior (covered in this report) from those that affect entitlement spending (not included here). This trend is worth watching because economic theory and empirical evidence suggest that the costs of economic types of regulation often outweigh the benefits.
Figure 1
Budgetary Costs of Federal Regulation, Adjusted for Inflation
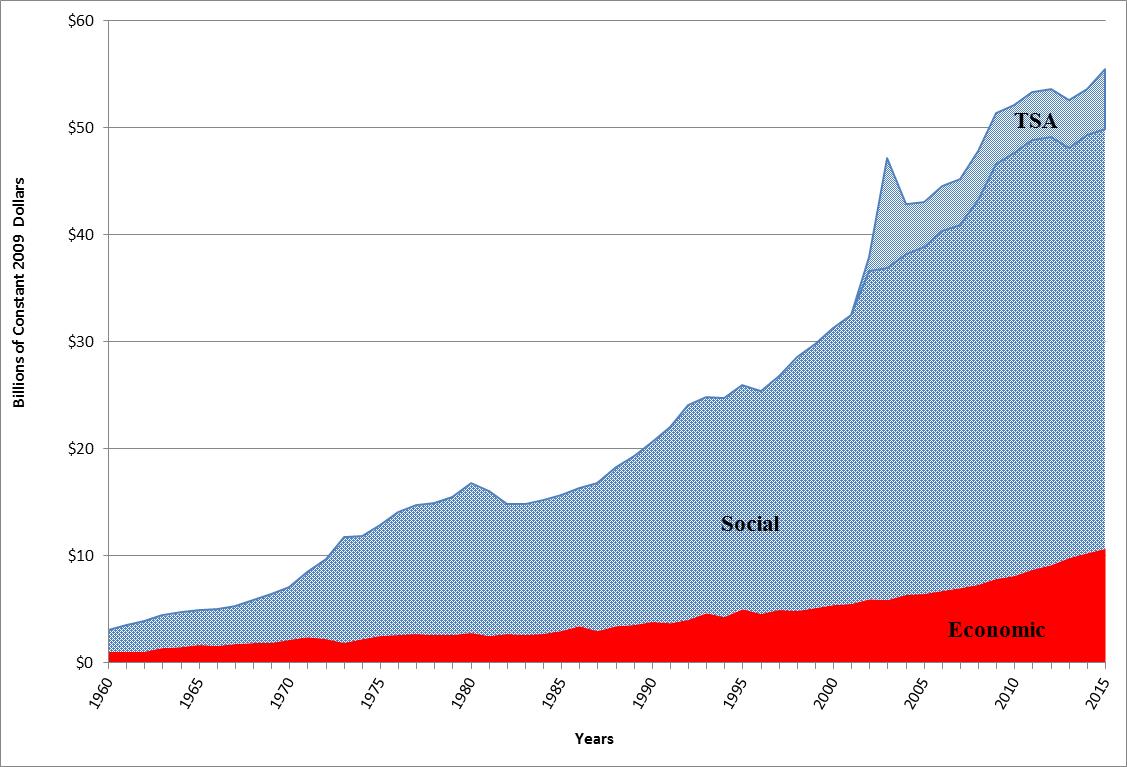
Figure 2
Staffing of Federal Regulatory Agencies
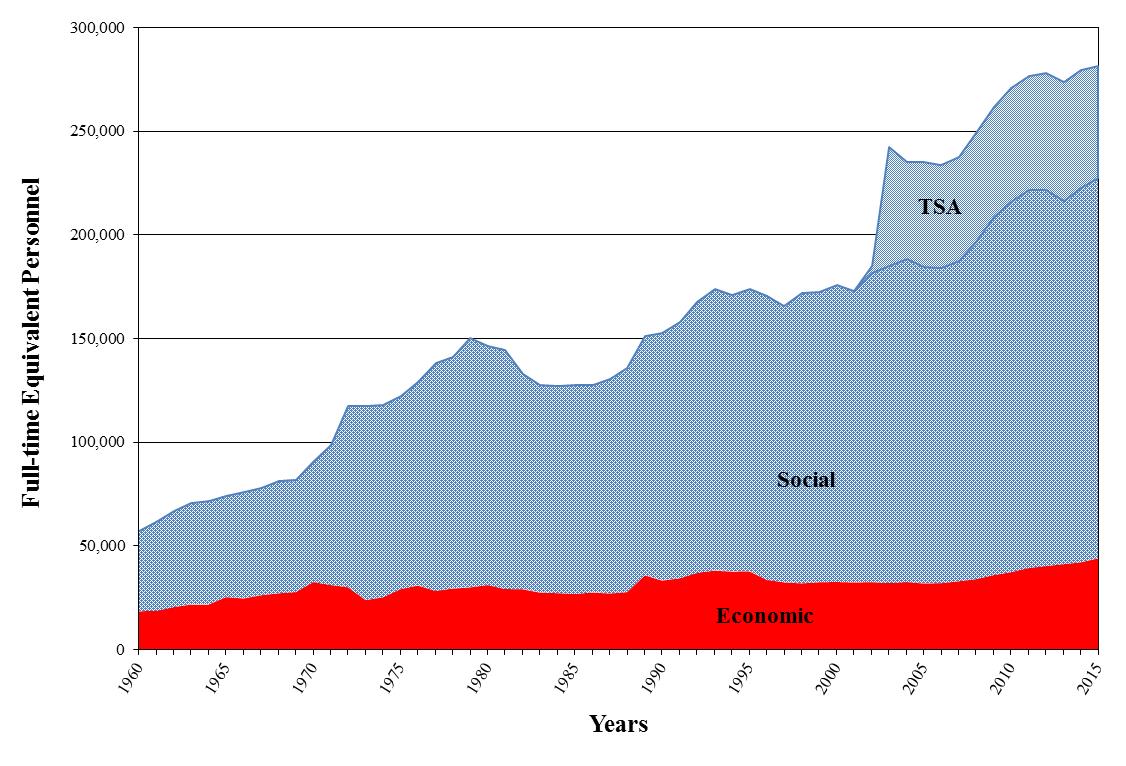
Table 1
Spending Summary for Federal Regulatory Agencies, Selected Years
(Fiscal Years, Millions of Dollars in “Outlays”)*
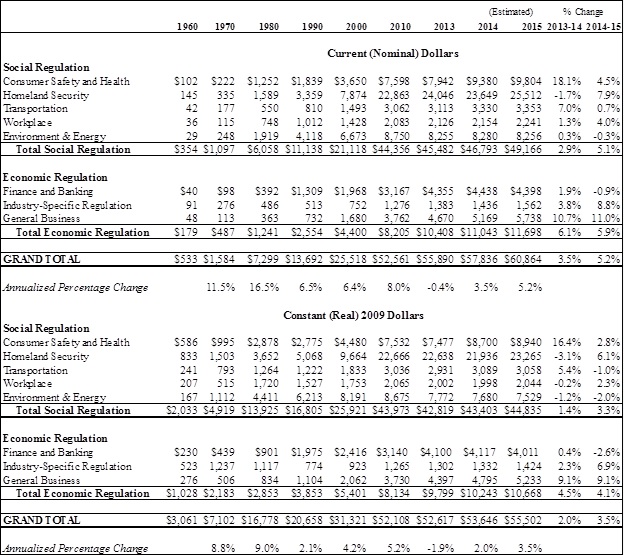
* FY 2014 estimates generally reflect appropriated outlays, while FY 2015 estimates reflect the President’s request to Congress, as presented in the FY 2015 Budget of the United States Government. While the percentages reported for the decennial years represent annualized growth rates over the decade, the percentages for fiscal years 2013-2015 each represent a one-year change.
Table 3
Staffing Summary for Federal Regulatory Agencies, Selected Years
(Fiscal Years, Full-time Equivalent Employment)*
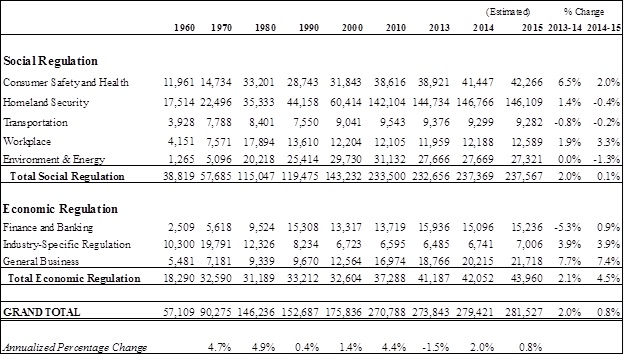
* FY 2014 estimates generally reflect appropriated staffing levels, while FY 2015 estimates reflect the President’s request to Congress, as presented in the FY 2015 Budget of the United States Government. While the percentages reported for the decennial years represent annualized growth rates over the decade, the percentages for fiscal years 2013 through 2015 each represent a one-year change.