
As Presidential administrations begin to wind down during their “lame duck” period, the executive’s decrease in political influence in congress has historically been accompanied by a significant increase in the amount of regulations published by executive regulatory agencies, particularly during the final three months between Election Day and Inauguration Day. This flurry of last-minute regulatory activity, identified as early as the Carter administration’s transition to Reagan, is known as the Midnight period. Midnight rules are so named because they are the result of an executive fully exercising its power to influence policy through regulation in a rush to beat the “stroke of Midnight” on inauguration day, which removes its political power—like Cinderella’s magic running out as she leaves the ball.
Scholars have studied the politics concerning the outcomes of this Cinderella constraint, both quantitatively and qualitatively, but the occurrence of Midnight rules also affects the amount of time and regulatory oversight that rules receive before being published. This has direct implications for the quality of review that the Office of Information and Regulatory Affairs (OIRA) is able to provide.
Tracking Differences among Presidencies
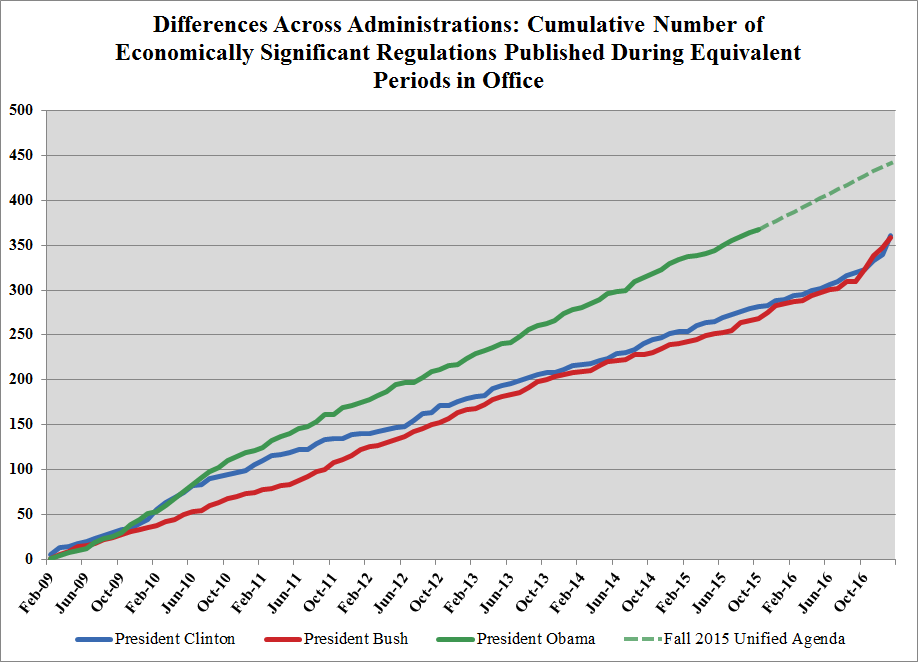
In order to get a better sense of what the next Midnight period might mean for the quality of regulatory oversight, it is important to compare President Obama’s current level of regulatory output relative to his predecessors’. Since Presidents Clinton and Bush both served for eight years as President, we are able to use the database at Reginfo.gov to track the volume of regulations published during their time in office and overlay them with President Obama’s pace for regulatory output through October of 2015. (See Figure 1.)
We focus our comparison on economically significant rules—those defined in Executive Order 12866 as likely to have “an annual effect on the economy of $100 million or more.” These rules are important, not only because of their impact on the economy, but also because studies have shown that every additional economically significant rule submitted to OIRA during the Midnight period decreases the mean review time of all regulations by almost a full day.
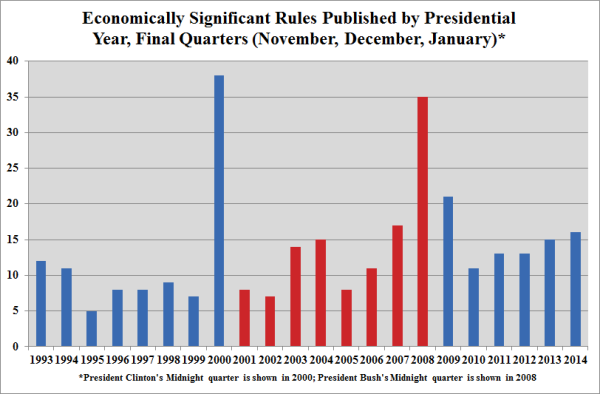
In addition to comparing the cumulative number of economically significant regulations published each month, we take a look at the last quarter of every President’s time in office, which we define here as the Midnight quarter, and compare these to other non-Midnight quarters to illustrate the level of increase in regulatory output across administrations. (See Figure 2.)
Economically Significant Regulations
We tracked the cumulative number of economically significant rules published by the previous two administrations and overlaid the data with President Obama’s regulatory output—which we collected through October 2015.* We begin counting rules as of February, after inauguration day, for each president, since any regulations published in January are actually the Midnight regulations from prior administrations. Over their 8-year terms, President Clinton issued a total of 361 rules and President Bush issued 358. As of the end of October, President Obama has already surpassed those counts, with a total of 367 economically significant rules; it is noteworthy that his administration has 15 months remaining to continue issuing regulations. The recently released Fall 2015 Unified Agenda includes 74 economically significant rules currently slated for publication before the end of the President’s term; if these final rules are all issued on schedule, President Obama’s 8-year total would be 441. The Unified Agenda serves as a good indicator for upcoming regulatory output, but the actual number of published rules could be lower if agencies don’t finish the rules they are working on or higher if something unexpected arises.
Visualizing the Magnitude of Midnight Regulatory Activity
To demonstrate the increase in rules issued during the Midnight quarter it is useful to compare regulatory activity in this three-month window with comparable “final quarters” (November, December, and January) during non-Midnight periods. President Clinton averaged 8.5 economically significant rules per month for non-Midnight final quarters and issued a total of 38 economically significant rules during his Midnight quarter—4.5 times the average for other final quarters. President Bush averaged 11.4 economically significant rules per month for non-Midnight final quarters and issued a total of 35 economically significant rules during his Midnight quarter—roughly 3 times the average for other final quarters. President Obama has not reached his Midnight period, but he currently averages around 15 economically significant rules issued for non-Midnight final quarters.
* Note that due to a lag in recording publication dates, this may understate the number of published rules in recent months.