
Over the weekend, the Office Management and Budget (OMB) released its annual Draft Report to Congress on the Benefits and Costs of Federal Regulations (“the Report”), which provides a window into regulatory activity conducted by federal agencies in Fiscal Year 2013. The Report indicates that the new regulations issued last fiscal year involve lower annual costs and benefits than in FY 2012, and that the Environmental Protection Agency (EPA) is by far the largest contributor to both regulatory costs and benefits in this Report.
The 2014 Report provides an accounting of the costs and benefits of major regulations issued in FY 2013, along with those of major regulations issued in the past ten years. While limited in scope (the draft Report totals include benefit and cost data for only 29 percent of the major non-transfer regulations issued in FY 2013), these data can be used by the public to evaluate trends in regulatory costs and benefits over time.
As can be seen in Figure 1, the annual costs of new regulations were significantly less in FY 2013 ($3 billion per year) than in FY 2012 ($20 billion per year). While the new regulations issued in FY 2013 are still in effect, and their annual costs are recurring, the added annual costs of new regulations in FY 2013 are only 15% of the new costs tallied in FY 2012.
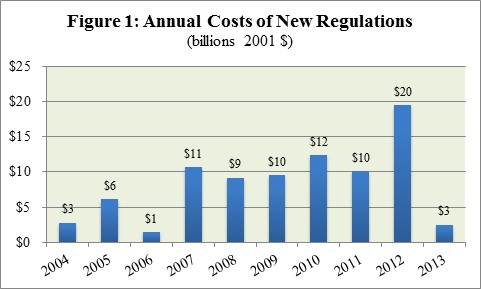
However, annual benefits from new regulations are also less in FY 2013 than in FY 2012, at $67 billion compared to $115 billion.
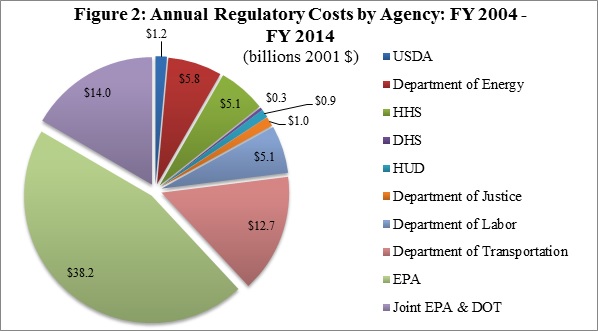
The Report also provides estimates of the total benefits and costs of regulations issued over the last 10 years, and a breakdown by agency. OMB’s accounting suggests that the largest regulations issued over the last decade for which agencies estimated both benefits and costs provide benefits of $813.2 billion per year and costs of $84.3 billion (benefits and costs measured in 2001 $). As can be seen below in Figure 2, two agencies, EPA and the Department of Transportation (DOT), contributed the majority of regulatory costs for the past 10 fiscal years. Including joint EPA and DOT rules (such as CAFE standards that increase vehicle fuel economy), these rules comprise 77% of total regulatory costs.
Source: OMB 2014 Draft Report to Congress on the Benefits and Costs of Federal Regulations Table 1-1. OMB reports data by fiscal years except the first year of each president’s term, which begins on January 20th of that year.
OMB addresses this trend in the Report, saying that “the rules with the highest estimated benefits as well as the highest estimated costs, by far, come from the Environmental Protection Agency and in particular its Office of Air and Radiation.” More specifically, OMB estimates that EPA rules account for between 63 – 82 percent of the monetized benefits and between 46 – 56 percent of the monetized costs of the rules included in the Report.
OMB also states that 98 – 99 percent of the benefits of EPA rules are provided by rules that seek to make improvements in air quality, the majority of which do so through reduction of a single air pollutant: particulate matter (PM). This is concerning for those interested in sound regulatory analysis, because there are still doubts in the academic community as to whether reductions in PM—claimed as significant benefits in EPA’s rules—actually result in any improved outcomes for human health.