
Sofie E. Miller
On October 16, the Office Management and Budget (OMB) released its annual Draft Report to Congress on the Benefits and Costs of Federal Regulations (“the Report”), which provides a window into regulatory activity conducted by federal agencies in Fiscal Year 2014. The Report indicates that the new regulations issued last fiscal year have both higher costs and lower benefits than those issued in FY 2013, and that the Environmental Protection Agency (EPA) remains by far the largest contributor to both regulatory costs and benefits in this Report.
“The Report”
The 2015 Report provides an accounting of the costs and benefits of major regulations issued in FY 2014, along with those of 120 major regulations issued in the past ten years. While limited in scope (the draft Report totals include benefit and cost data for only 24% of the major regulations issued in FY 2014), these data can be used by the public to evaluate trends in regulatory costs and benefits over time.
Benefits lower, costs higher
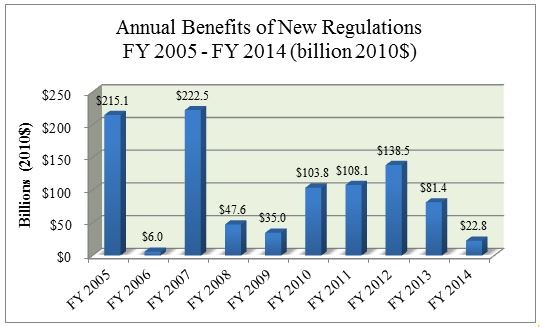
As can be seen below, estimated annual benefits of new regulations were significantly less in FY 2014 ($28.8 billion per year) than in FY 2013 ($81.4 billion per year). At the same time, estimated annual costs of new regulations increased from $3 billion in FY 2013 to $4.4 billion in FY 2014.
The Report also provides estimates of the total benefits and costs of regulations issued over the last 10 years, and a breakdown by agency. OMB’s accounting suggests that the largest regulations issued over the last decade for which agencies estimated both benefits and costs provide benefits of $981 billion per year and costs of $102.9 billion (benefits and costs measured in 2010 $).
EPA and DOT regulations incur highest costs
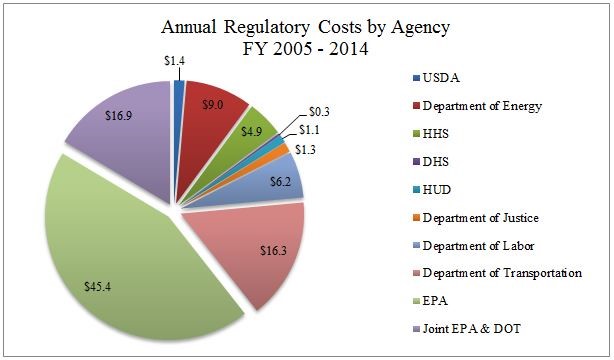
As can be seen in the figure below, two agencies, EPA and the Department of Transportation (DOT), contributed the majority of regulatory costs for the past 10 fiscal years. Including joint EPA and DOT rules (such as CAFE standards that increase vehicle fuel economy), these rules comprise 76% of total regulatory costs.
Source: OMB 2014 Draft Report to Congress on the Benefits and Costs of Federal Regulations Table 1-1. OMB reports data by fiscal years except the first year of each president’s term, which begins on January 20th of that year.
OMB addresses this trend in the Report, saying that “the rules with the highest estimated benefits as well as the highest estimated costs, by far, come from the Environmental Protection Agency and in particular its Office of Air and Radiation.” More specifically, OMB estimates that EPA rules account for between 61% and 80% of the monetized benefits and between 44% - 55% percent of the monetized costs of the rules included in the Report. EPA’s estimated benefits also vary by a factor of almost five, with benefits ranging from $160.2 billion to $787.7 billion.