
The Office of Management and Budget (OMB) recently published its Exit Memo highlighting several aspects of the agency’s work under President Obama. The memo includes quantitative metrics of the administration’s regulatory output to draw comparisons with the numbers of regulations issued by agencies under Presidents Clinton and Bush.
OMB states that “by several measures, this Administration has seen a significant decrease in the number of regulations issued.” Although this statement is accurate, the measures used by OMB—either 1) total rules or 2) significant rules reviewed by the Office of Information and Regulatory Affairs (OIRA)—do not provide a full picture of regulatory activity and may not be as revealing as other metrics for comparing regulatory output across administrations. This is due to the fact that they do not sufficiently distinguish between comparatively lower impact, or even routine, regulations and those likely to have a large impact, often hundreds of millions or even billions of dollars in benefits or costs.
For example, the total rules metric includes routine items published in the Federal Register such as operating times for drawbridges and details concerning fireworks displays. The significant rules metric, although more refined, still captures a broad range of regulations. Although no single metric is likely to capture all of the most “important” or “highest impact” regulations, economically significant—defined in Executive Order (EO) 12866 as rules likely to have “an annual effect on the economy of $100 million or more”—is a more useful measure for comparing regulatory output across administrations.
The economically significant metric has the following advantages:
- It excludes most routine or otherwise less significant rules.
- Its definition has been consistent since 1981, allowing comparisons over many years (whereas the definition of “significant” changed in 1993).
- A fixed threshold facilitates a transparent classification of rules.
It is worth mentioning that any regulatory count is a proxy measure for how active an administration is in using regulation to implement its policy priorities. It does not provide a judgment on the quality of any individual rule.
A Comparison of Economically Significant Rules
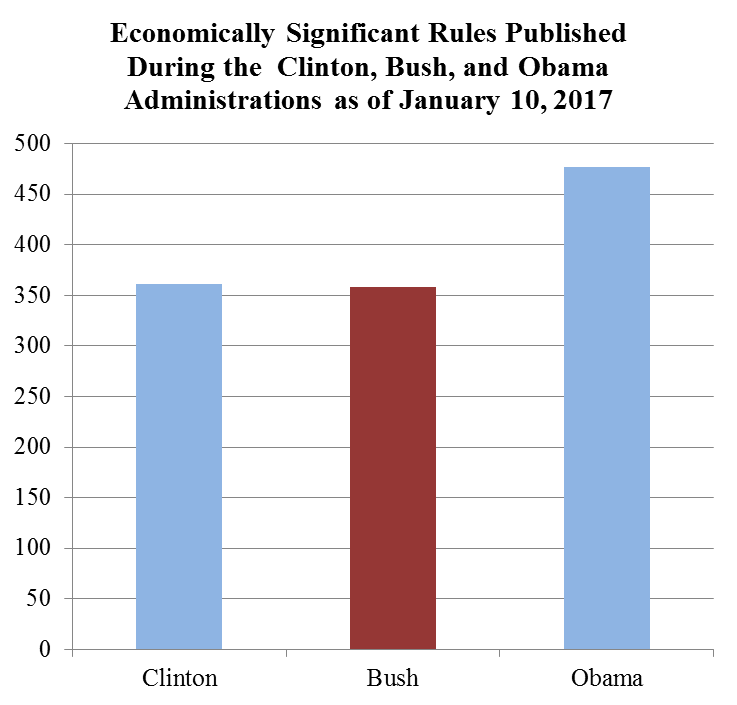
Comparing regulatory output across administrations using economically significant rules presents a markedly different result than is presented in OMB’s Exit Memo. As of September 2015, executive branch agencies under the Obama administration had surpassed the total number of economically significant regulations published during the entire Clinton and Bush administrations, 361 and 358 respectively.
As of January 10, 2017, the Obama administration has published 477 economically significant rules; additional regulations are slated for publication in the next 10 days, as executive branch agencies rush to implement their remaining policy priorities before a new president is sworn in. These data indicate that the Obama administration has been a significantly more active regulator than either the Clinton or Bush administrations.
Does Adjusting for Inflation Change the Results?
Some observers might agree with using a quantitative metric to compare regulatory output across administrations but point out that the threshold of $100 million used to classify a regulation as economically significant has not been adjusted for inflation (EO 12866 was issued in 1993).
Could inflation account for the observed increase in economically significant rules over the last 8 years? The following calculations rely on OMB data to explore this question.
If the threshold for a rule to be considered economically significant had been adjusted for inflation at the beginning of the Obama administration from its 1993 value, the new threshold would be roughly $150 million. OMB recently released its Draft Report to Congress on the Benefits and Costs of Federal Regulations. Table A-1 lists “Agency Estimates for Final Rules” from October 1, 2014 through September 30, 2015; Table A-2 lists “Estimates of Annual Benefits and Costs of Major Final Rules” from October 1, 2005 through September 30, 2014. These tables are not an exhaustive list of all economically significant rules issued over that 10 year period, but they do provide estimates of benefits and costs for 132 such rules, including 92 issued during the Obama administration (between January 2009 and September 2015).
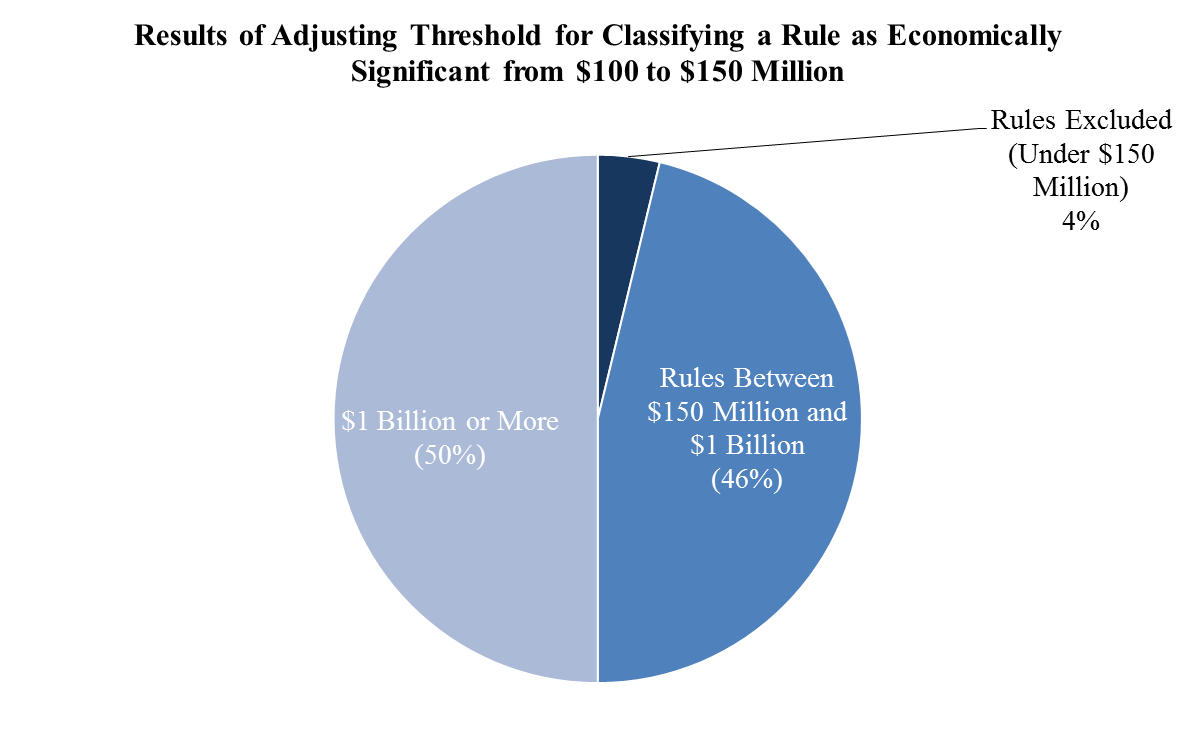
Converting OMB’s estimated benefits and costs to 2009 dollars and checking them against the higher, inflation-adjusted threshold reveals that inflation does not account for any of the rules classified as economically significant. Out of 92 rules, four had impacts below the $150 million threshold, but those four also didn’t meet the non-adjusted $100 million threshold, suggesting that OMB classified them as major based on impacts that could not be quantified in monetary terms.
In short, there is no evidence to suggest that not adjusting the economically significant threshold for inflation accounts for the observed increase in regulatory output during the Obama administration compared to either the Clinton or Bush administrations.
Billion Dollar Rules
The OMB data reveal another interesting fact: close to half of the economically significant regulations issued over the 10 year window have benefits or costs in the billions. During the first five-and-a-half years of the Obama administration (through September 2015), 45 of the 92 regulations covered by the report were estimated to have annual costs or benefits of over $1 billion per year. Since then, agencies have issued numerous other billion-dollar regulations.
Conclusion
Economically significant rules are a more useful metric than others for drawing comparisons of regulatory output across administrations. Other measures include lower impact and even routine regulations that are not likely to help characterize an administration’s regulatory priorities. Finally, this measure has been consistent since 1981, and not adjusting its $100 million threshold for inflation has not demonstrably reduce its utility—particularly since roughly half of such rules have annual costs or benefits of over $1 billion per year.