
Download this Commentary (PDF)
In brief...
The pace of rulemaking has declined for several decades, with the number of final and proposed rules falling from 1995 to 2020. One plausible explanation for this trend is that federal agencies are crafting bigger rules over time, in terms of both page length and economic impact.
Introduction
In recent years, scholars and policymakers have paid extensive attention to the accumulation of regulation and its costs. Regulatory reform efforts have often taken aim at the cumulative regulatory burden by targeting a subset of regulatory activity. Notably, less attention has focused on the overall trend in published rulemakings, even though several thousand are issued each year. This commentary uses almost three decades of data on proposed and final rules to better understand how the pace of regulatory activity has changed. The rate of rulemaking indicates a trend toward fewer but larger rules, suggesting that the decline in activity is plausibly attributable to bigger agency actions.
Measuring Regulation
In general, different measures of regulatory activity are neither right nor wrong; rather, they communicate different information. Multiple metrics exist that document the either the stock of regulations (i.e., the cumulative set of regulations in effect at a given time) or the flow or incremental change in regulations over a time period. The Regulatory Studies Center’s Reg Stats resource reports several measures, such as page counts for the Code of Federal Regulations (a stock variable) and annual rulemakings published in the Federal Register (a flow variable). This commentary focuses on the latter measure as an indicator of how the pace of regulatory activity has changed over time.
Annual rulemakings published in the Federal Register are best characterized as measuring the number of regulatory actions issued by federal agencies each year. They estimate the level of regulatory activity conducted by agencies in terms of proposed and final rules—the essential components of the notice-and-comment rulemaking process. Other alternative measures like annual pages appearing in the Federal Register include actions that do not change regulatory requirements, such as notices and presidential orders. Other sources like the Office of Information and Regulatory Affairs’ regulatory review data only report on a subset of rules, leaving out many smaller rules and actions from independent agencies.
Rules are Declining
While measures of regulatory stock typically indicate that regulation in the US is accumulating over time, the number of annual rulemakings has been steadily decreasing since at least the mid-1990s. Using data from the Federal Register API, which is searchable back to 1994, agencies have been publishing fewer proposed rules and final rules per year over the last 25 years.[1] Figure 1 depicts the annual count of rules published in the Federal Register from 1995 to 2020.
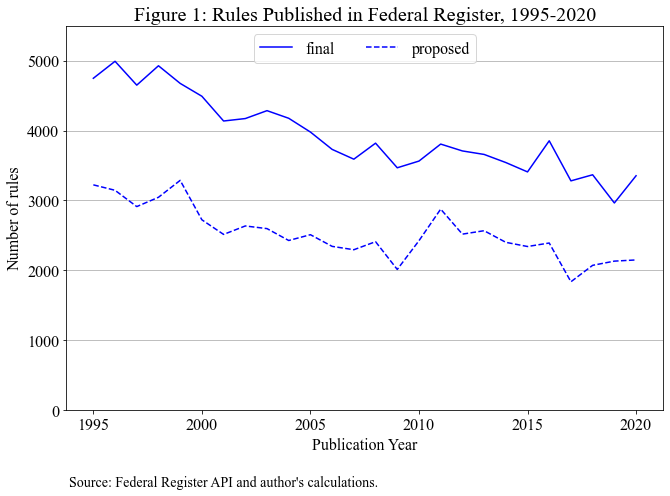
At first glance, this finding might be surprising in light of frequent discussions about regulatory accumulation. Primarily, the disconnect can be attributed to the differences between measures of stocks and flows, since cumulative increases may occur even when the marginal growth rate is falling. Beyond the distinction between stock and flow variables, the decline in rules is still salient and has received less attention. So, why are agencies issuing fewer regulations overall, even as total regulation is growing? Based on the data, one explanation is that agencies are crafting bigger rules over time.
A Plausible Explanation: Rules are Growing Larger
Several distinct, but not mutually exclusive, explanations could account for the decline in new agency rules, such as “ossification” in the rulemaking process, which posits that notice-and-comment rulemaking has become increasingly time- and resource-intensive because of accumulated procedural and analytical requirements (among other factors). However, empirical evidence as to whether ossification is happening is mixed. This commentary focuses on a different (but not unrelated) explanation—namely, rules could be becoming relatively larger, in turn reducing the volume of proposed and final rules as related regulatory actions are combined and resource tradeoffs become greater. Here, several pieces of evidence support this explanation.
One piece relates to the growth in large rules in terms of their estimated economic impact—specifically, economically significant rules and major rules. Executive Order 12866 defines economically significant rules as rules from executive agencies that have an estimated annual impact of $100 million or more on the economy. Major rules share a similar definition based on the Congressional Review Act but also include independent agencies, not just agencies governed by executive orders. Because of the overlap between these two sets of rules, the data points follow each other closely, as shown by Figure 2.
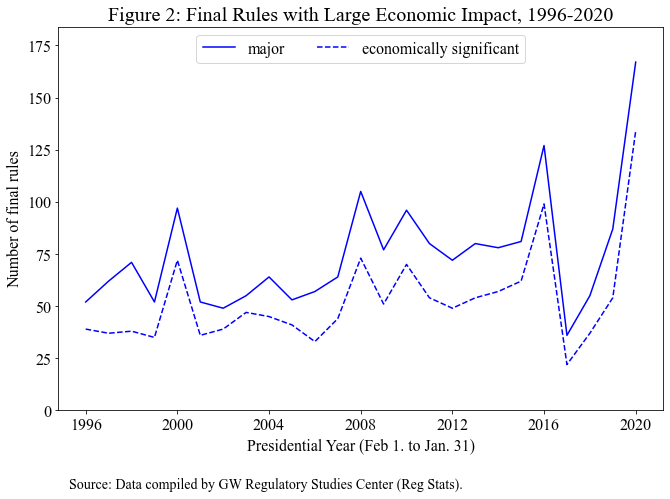
Both definitions of final rules with a large economic impact have a generally upward sloping trend. The spike at the end of each presidential transition coincides with the midnight rulemaking phenomenon, with the largest increase at the end of Trump administration (although this may be partly due to the regulatory response to the COVID-19 pandemic). There is also a very large drop at the beginning of Trump’s presidency, most likely reflecting an initial freeze on new rulemaking. The data suggest that the later climb in rules during the midnight period offset the early reduction in large rules. Adjusting for time in office, President Trump was on track to issue more economically significant rules than any previous president (this number includes both regulatory and deregulatory actions).
Another way to estimate whether “large” rules have increased is to look at the length of published rules in terms of page counts. Figure 3 examines the mean page length of final and proposed rules published in the Federal Register from 1995 to 2020, presenting the data by “presidential year” (Feb. 1 to Jan. 31) to account for changes in presidential administrations (the calendar year data produce nearly identical trajectories).
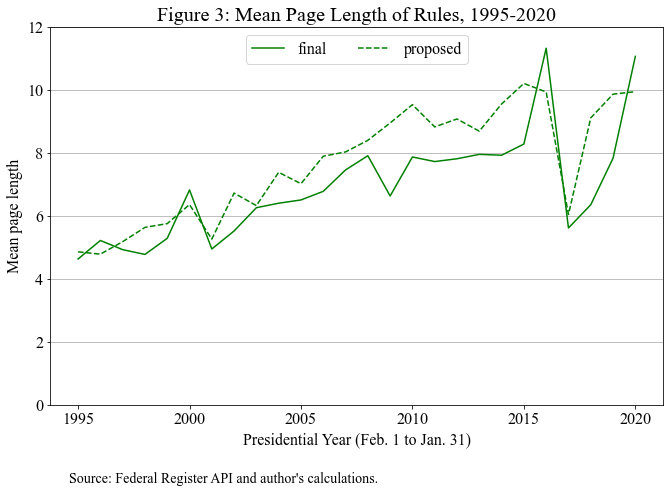
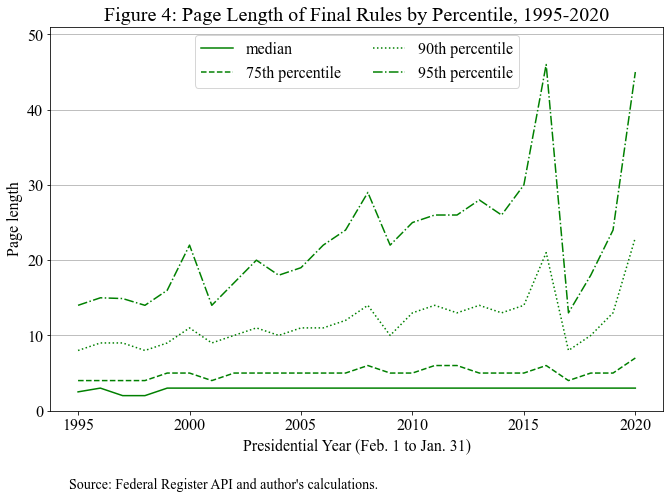
Using the same data source as Figure 1, which prompted the initial question, average page lengths for proposed and final rules have increased over time. These data provide additional confirmation that rulemakings are getting larger, at least in terms of how long they are. To account for the possibility of the longest rules skewing the average page length, Figure 4 tracks page lengths of final rules by four percentiles (50th, 75th, 90th, and 95th). The median is flat over time, reflecting how the majority of rules are relatively short in length, but an upward slope is evident at higher percentiles. In other words, the increase in page length has occurred across the board and not merely in a handful of outliers. Although not shown for the sake of space, this pattern holds true for proposed rules as well, as they follow a similar but more pronounced upward trend for each percentile.
Conclusion
While the preceding analysis of these data is not definitive, it represents strong evidence that the trend in larger rules is factoring into the overall decline in the number of proposed and final rulemakings during the last quarter century. First, rules have become bigger in terms of their economic impact, with more economically significant rules and major rules being finalized each year. Second, the page length of proposed and final rules has also grown across the board. Furthermore, these data are consistent with other observed trends like regulatory bundling—i.e., the broadening of the scope of a rulemaking by aggregating discrete issues. Of course, the increased size of agency rules is not mutually exclusive with other causes for the downward trend in rulemaking over time, such as ossification. Nevertheless, exploring plausible explanations may help researchers better understand the regulatory process and the specific outputs it produces.
[1] The metadata for the Federal Register data in the 1990s are incomplete, with some documents remaining uncategorized (i.e., not being categorized as rules, proposed rules, notices, or presidential documents). The 1994 metadata are scarce enough to make them unreliable. The data from 1995 and on are sufficiently reliable but somewhat understate the trends shown.